AI assessment of infrastructure income and expenses of walkable vs car-centric.
| Category | Acreage | % of County Land | Property Tax/acre | Sales Tax/acre | Total Tax/acre | Service Cost/acre | Net Fiscal/acre | Walk Score | |
| Walkable Commercial Areas | 1,500 | <1% | ~$225,000 | ~$100,000 | ~$325,000 | ~$115,000 | +$210,000 | 85-95 | $315,000,000 |
| Walkable Recreational Areas | 15,000 | ~6% | $0 | $0 | $0 | ~$1,500 | -$1,500 | 40-70 | -$22,500,000 |
| Car-Centric Areas | 200,000 | ~75% | ~$10,000 | ~$6,000 | ~$16,000 | ~$20,000 | -$4,000 | 10-40 | -$800,000,000 |
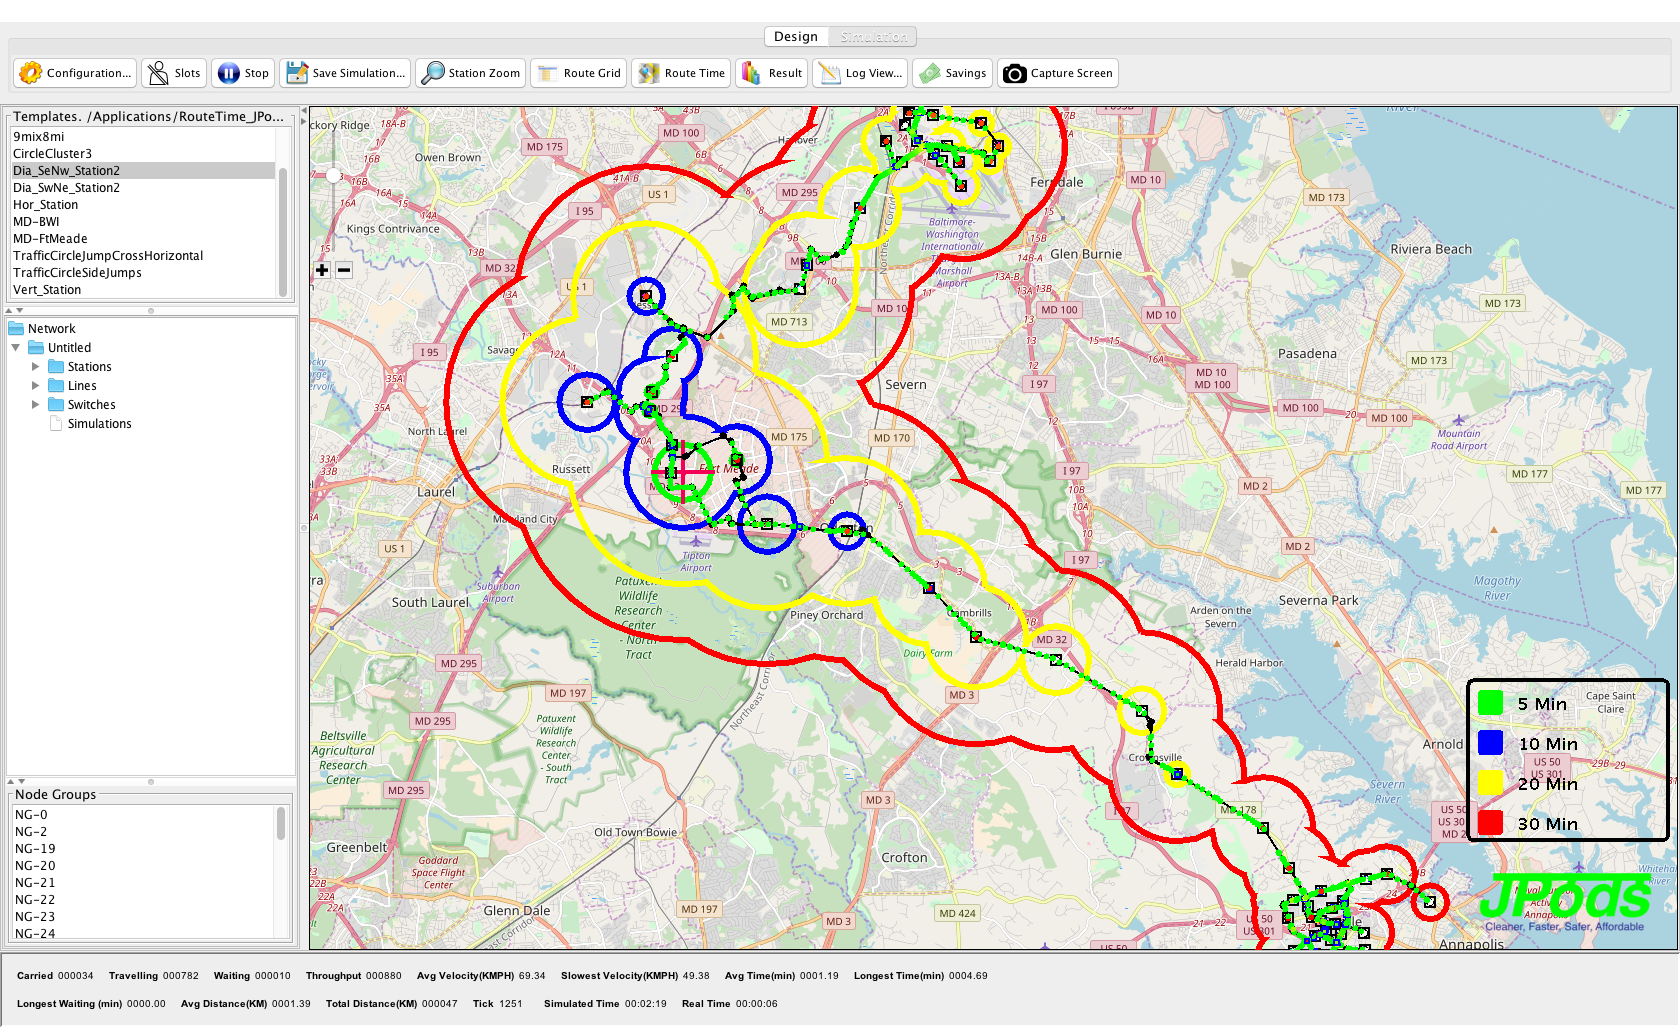
Connecting Annapolis to BWI (link to images of JPods at BWI).
Travel times from Fort Meade, MD to BWI and Annapolis.
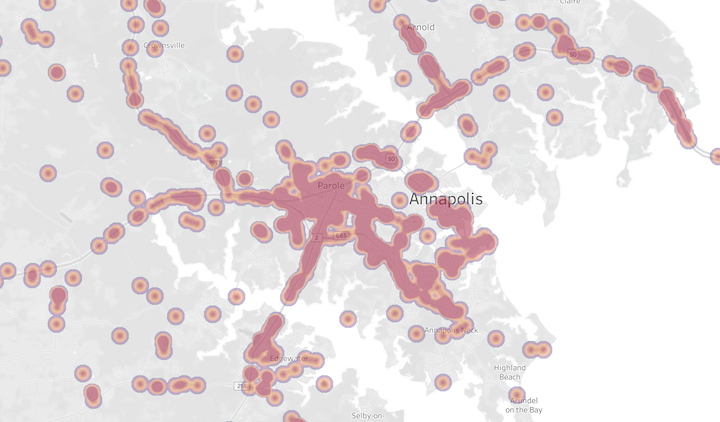
Accident heat map and Vision Zero
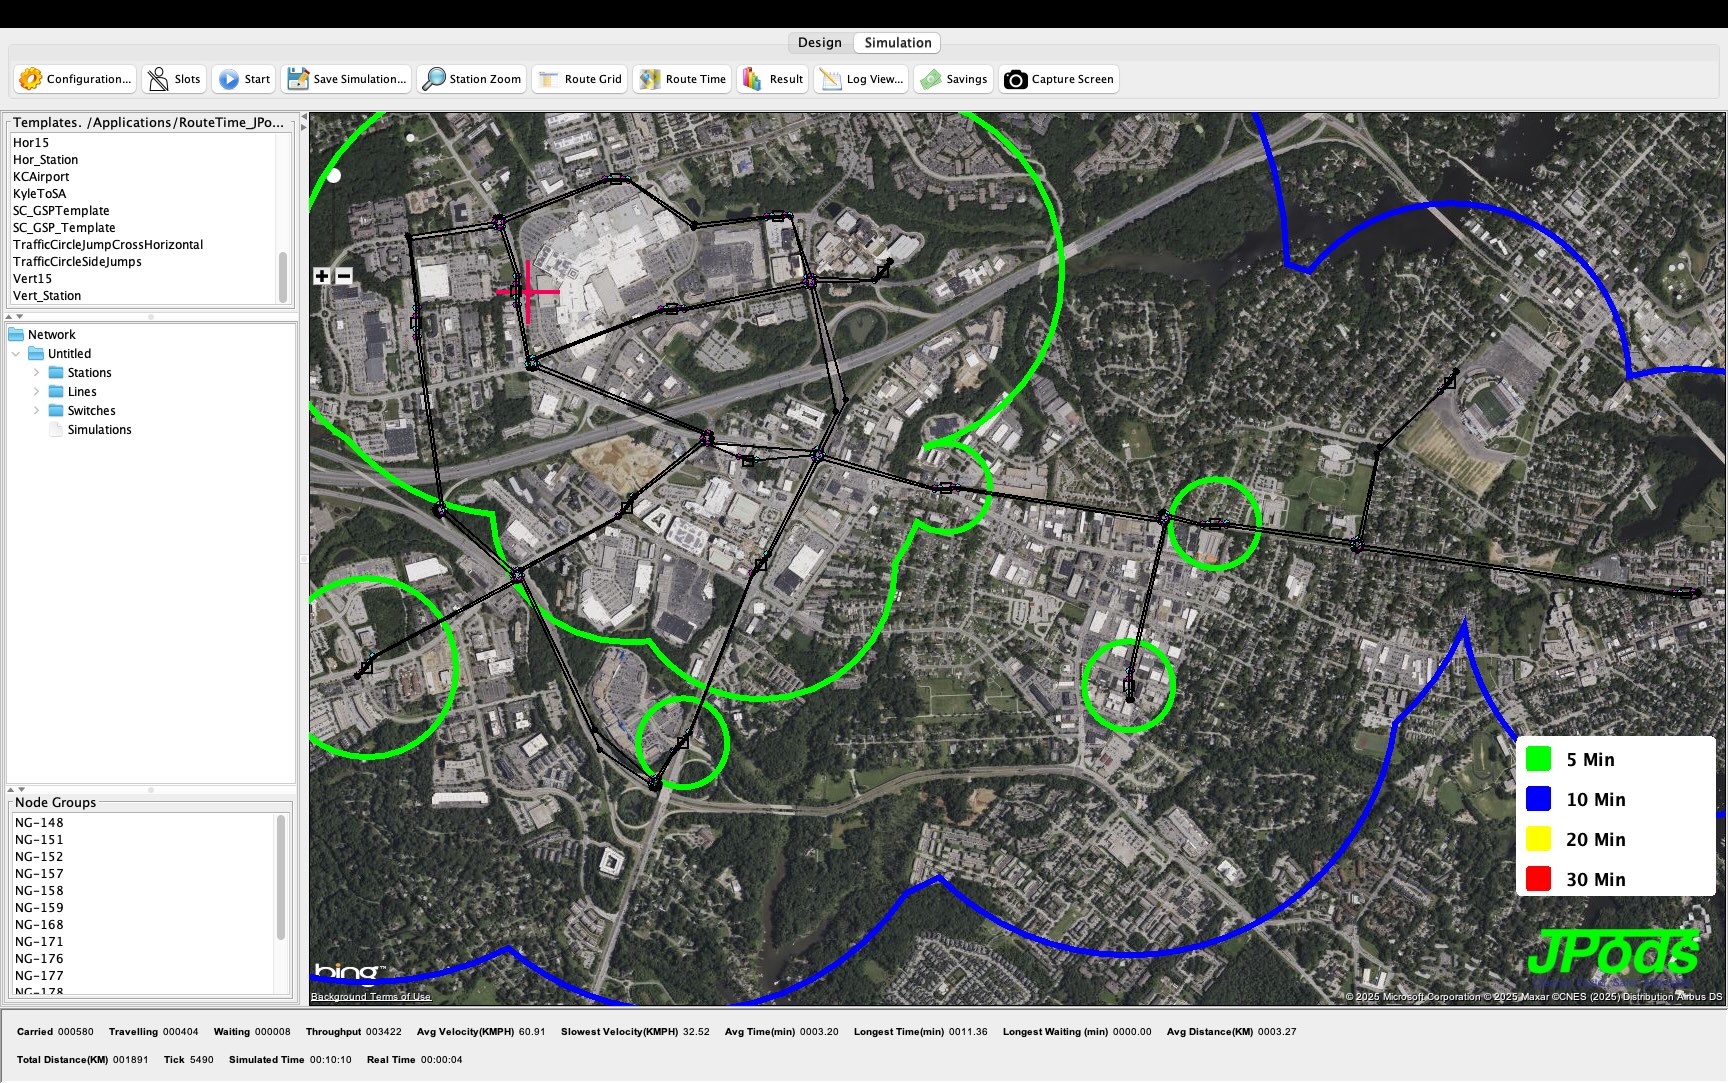
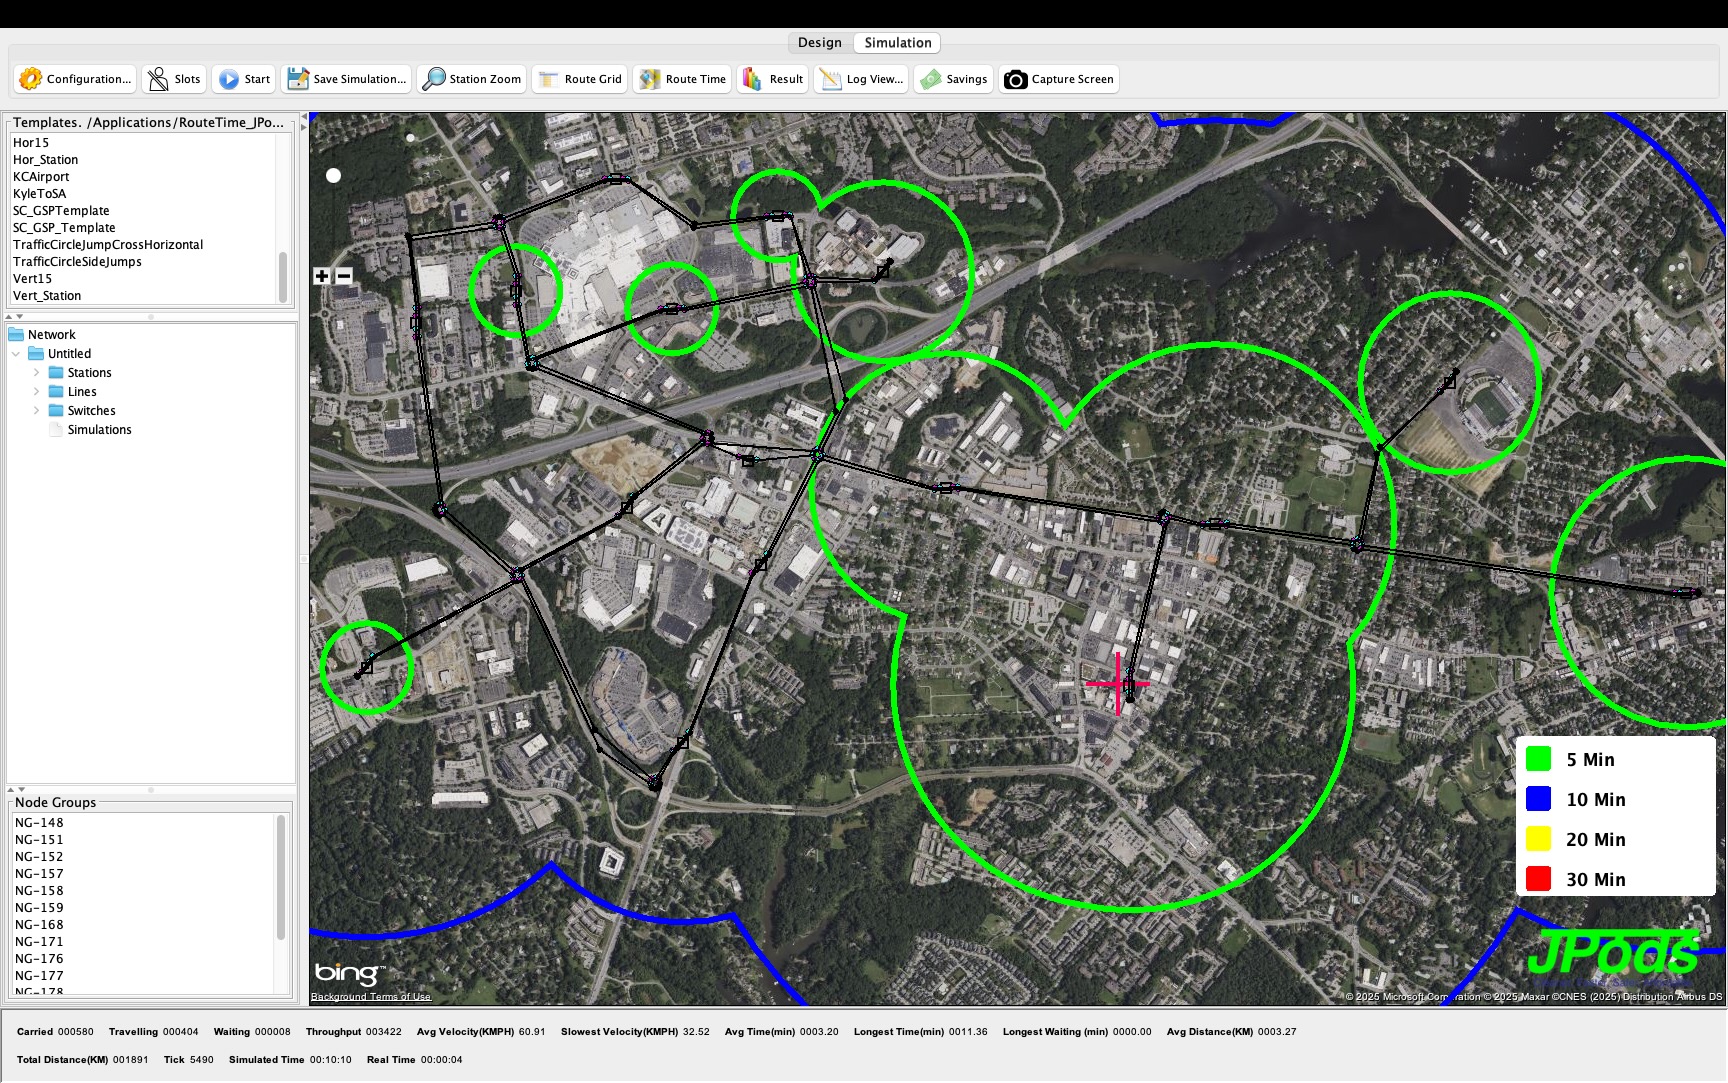
Making the malls in Annapolis walkable. Car crashes are common as people move between shopping area separated by highways.